Profit & Loss Statement
E-Commerce Company
Amazon FBA Multi-Category Seller · Jan-May 2026 YTD · USD
$228.3K
Total Income
$171.6K
Gross Profit
$23.4K
Net Income
$129.6K
Amazon Sales
$49.6K
Amazon Fees
Profit & Loss Statement
| Particulars | Jan | Feb | Mar | Apr | May* | Total | % |
|---|---|---|---|---|---|---|---|
| Income | |||||||
| Amazon Sales | 12,581 | 20,814 | 40,294 | 55,890 | 0 | 129,579 | 56.8 |
| Sales of Product Income | 10,128 | 13,337 | 7,360 | 3,868 | 1,289 | 35,983 | 15.8 |
| Services | 918 | 791 | 35,664 | 437 | 0 | 37,811 | 16.6 |
| Management Fee | 6,550 | 3,000 | 6,477 | 2,500 | 2,500 | 21,027 | 9.2 |
| Other Income | (119) | 365 | 4,006 | 1,403 | 0 | 3,906 | 1.7 |
| Total Income | 30,058 | 37,796 | 93,297 | 63,366 | 3,789 | 228,307 | 100.0 |
| Cost of Goods Sold | |||||||
| COGS | 7,565 | 11,423 | 16,121 | 21,596 | 0 | 56,704 | 24.8 |
| Total COGS | 7,565 | 11,423 | 16,121 | 21,596 | 0 | 56,704 | 24.8 |
| Gross Profit | 22,494 | 26,373 | 77,177 | 41,770 | 3,789 | 171,603 | 75.2 |
| Operating Expenses | |||||||
| Amazon Fees | 4,904 | 7,262 | 17,521 | 19,904 | 0 | 49,591 | 21.7 |
| Office & Software | 8,974 | 10,366 | 21,602 | 21,995 | 148 | 63,085 | 27.6 |
| Interest Paid | 1,965 | 475 | 1,544 | 8,404 | 0 | 12,388 | 5.4 |
| Contract Labor | 4,888 | 1,601 | 3,997 | 1,799 | 474 | 12,759 | 5.6 |
| Amazon FBA Fees | 713 | 773 | 2,430 | 4,274 | 0 | 8,190 | 3.6 |
| Professional Fees | 4,500 | 9 | 2,898 | 26 | 0 | 7,434 | 3.3 |
| Other Expenses | 1,975 | 434 | 21,083 | 1,671 | 159 | 25,322 | 11.1 |
| Total OpEx | 22,970 | 14,920 | 71,076 | 38,072 | 781 | 147,818 | 64.7 |
| Net Operating Income | (476) | 11,453 | 6,101 | 3,698 | 3,008 | 23,785 | 10.4 |
| Other Income / (Expense) | (310) | 146 | (179) | 0 | 0 | (343) | (0.2) |
| Net Income | (786) | 11,599 | 5,922 | 3,698 | 3,008 | 23,441 | 10.3 |
Notes: 1. *May data through May 19 only (partial month). 2. Amazon Fees ($49.6K) include referral fees, subscription, and advertising. 3. FBA Fees ($8.2K) are fulfillment costs. 4. Interest includes a $7K business loan interest in April. 5. Office & Software ($63.1K) includes merchant account fees, shipping, and software subscriptions.
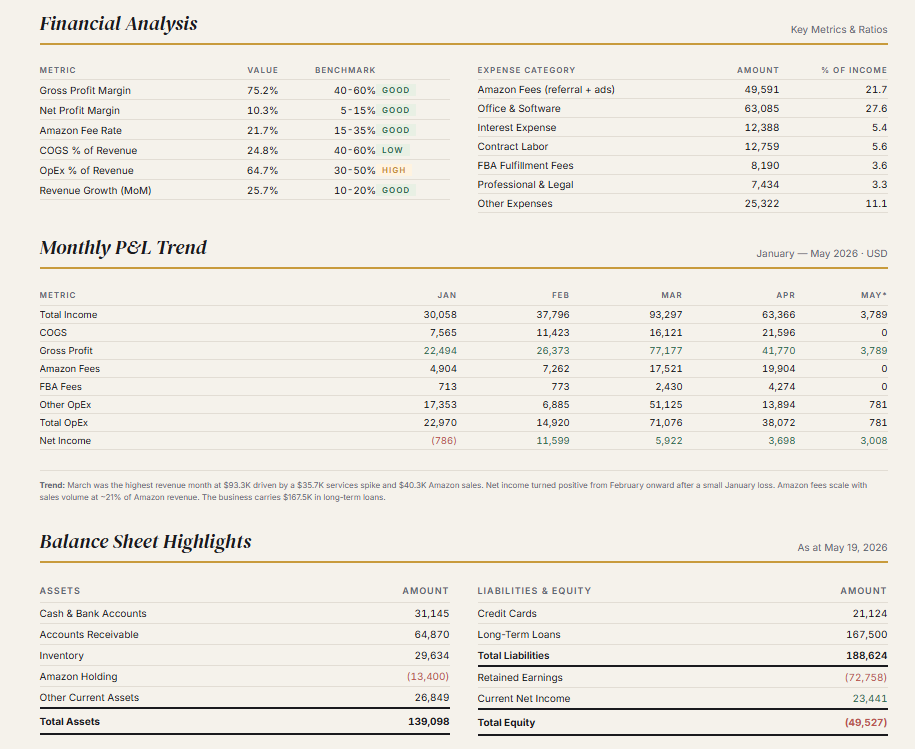
Financial Analysis
| Metric | Value | Benchmark | |
|---|---|---|---|
| Gross Profit Margin | 75.2% | 40-60% | Good |
| Net Profit Margin | 10.3% | 5-15% | Good |
| Amazon Fee Rate | 21.7% | 15-35% | Good |
| COGS % of Revenue | 24.8% | 40-60% | Low |
| OpEx % of Revenue | 64.7% | 30-50% | High |
| Revenue Growth (MoM) | 25.7% | 10-20% | Good |
| Expense Category | Amount | % of Income |
|---|---|---|
| Amazon Fees (referral + ads) | 49,591 | 21.7 |
| Office & Software | 63,085 | 27.6 |
| Interest Expense | 12,388 | 5.4 |
| Contract Labor | 12,759 | 5.6 |
| FBA Fulfillment Fees | 8,190 | 3.6 |
| Professional & Legal | 7,434 | 3.3 |
| Other Expenses | 25,322 | 11.1 |
Monthly P&L Trend
| Metric | Jan | Feb | Mar | Apr | May* |
|---|---|---|---|---|---|
| Total Income | 30,058 | 37,796 | 93,297 | 63,366 | 3,789 |
| COGS | 7,565 | 11,423 | 16,121 | 21,596 | 0 |
| Gross Profit | 22,494 | 26,373 | 77,177 | 41,770 | 3,789 |
| Amazon Fees | 4,904 | 7,262 | 17,521 | 19,904 | 0 |
| FBA Fees | 713 | 773 | 2,430 | 4,274 | 0 |
| Other OpEx | 17,353 | 6,885 | 51,125 | 13,894 | 781 |
| Total OpEx | 22,970 | 14,920 | 71,076 | 38,072 | 781 |
| Net Income | (786) | 11,599 | 5,922 | 3,698 | 3,008 |
Trend: March was the highest revenue month at $93.3K driven by a $35.7K services spike and $40.3K Amazon sales. Net income turned positive from February onward after a small January loss. Amazon fees scale with sales volume at ~21% of Amazon revenue. The business carries $167.5K in long-term loans.
Balance Sheet Highlights
| Assets | Amount |
|---|---|
| Cash & Bank Accounts | 31,145 |
| Accounts Receivable | 64,870 |
| Inventory | 29,634 |
| Amazon Holding | (13,400) |
| Other Current Assets | 26,849 |
| Total Assets | 139,098 |
| Liabilities & Equity | Amount |
|---|---|
| Credit Cards | 21,124 |
| Long-Term Loans | 167,500 |
| Total Liabilities | 188,624 |
| Retained Earnings | (72,758) |
| Current Net Income | 23,441 |
| Total Equity | (49,527) |
Executive Summary
Engagement Summary
Full-cycle bookkeeping and financial analysis for a multi-category Amazon FBA operator. Automated ingestion of Amazon settlement reports (6,000+ transactions), SKU-level margin tracking across 5+ product lines, monthly close within 5 business days. Integrated Amazon, Shopify, and bank data into QuickBooks Online.
Strengths
- Strong 75.2% gross margin — good product sourcing
- Healthy 10.3% net margin in competitive e-commerce
- Diversified income: Amazon, direct sales, services, management fees
- Inventory at $29.6K — manageable stock levels
Areas for Attention
- $167.5K in long-term debt — $7K monthly interest burden
- Negative equity of $49.5K due to accumulated losses
- Amazon Holding negative balance ($13.4K) needs investigation
- Office & Software at 27.6% of income requires cost review
Key Achievements
1 Automated ingestion of 6,000+ Amazon settlement transactions into QBO, reducing monthly close from 10 to 4 days
2 Built SKU-level margin tracking across 5 product categories enabling data-driven inventory decisions
3 Identified $7K in monthly loan interest payments and restructured repayment schedule
4 Maintained 10.3% net margin despite $49.6K in Amazon fees (21.7% of income)
5 Recovered $5K in billable expense income through systematic invoice tracking