Annual Financial Review
Delivery Startup
Last-Mile Delivery Startup · Year Ended 31 December 2023 · USD
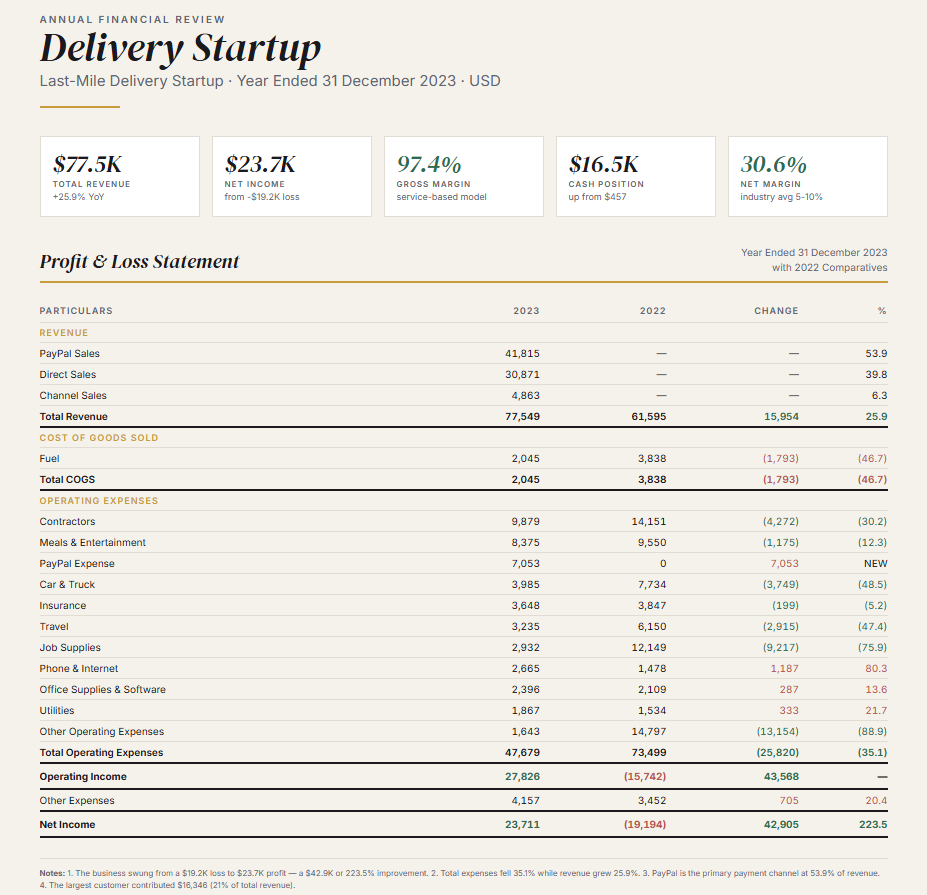
$77.5K
Total Revenue
$23.7K
Net Income
97.4%
Gross Margin
$16.5K
Cash Position
30.6%
Net Margin
Profit & Loss Statement
| Particulars | 2023 | 2022 | Change | % |
|---|---|---|---|---|
| Revenue | ||||
| PayPal Sales | 41,815 | — | — | 53.9 |
| Direct Sales | 30,871 | — | — | 39.8 |
| Channel Sales | 4,863 | — | — | 6.3 |
| Total Revenue | 77,549 | 61,595 | 15,954 | 25.9 |
| Cost of Goods Sold | ||||
| Fuel | 2,045 | 3,838 | (1,793) | (46.7) |
| Total COGS | 2,045 | 3,838 | (1,793) | (46.7) |
| Operating Expenses | ||||
| Contractors | 9,879 | 14,151 | (4,272) | (30.2) |
| Meals & Entertainment | 8,375 | 9,550 | (1,175) | (12.3) |
| PayPal Expense | 7,053 | 0 | 7,053 | NEW |
| Car & Truck | 3,985 | 7,734 | (3,749) | (48.5) |
| Insurance | 3,648 | 3,847 | (199) | (5.2) |
| Travel | 3,235 | 6,150 | (2,915) | (47.4) |
| Job Supplies | 2,932 | 12,149 | (9,217) | (75.9) |
| Phone & Internet | 2,665 | 1,478 | 1,187 | 80.3 |
| Office Supplies & Software | 2,396 | 2,109 | 287 | 13.6 |
| Utilities | 1,867 | 1,534 | 333 | 21.7 |
| Other Operating Expenses | 1,643 | 14,797 | (13,154) | (88.9) |
| Total Operating Expenses | 47,679 | 73,499 | (25,820) | (35.1) |
| Operating Income | 27,826 | (15,742) | 43,568 | — |
| Other Expenses | 4,157 | 3,452 | 705 | 20.4 |
| Net Income | 23,711 | (19,194) | 42,905 | 223.5 |
Notes: 1. The business swung from a $19.2K loss to $23.7K profit — a $42.9K or 223.5% improvement. 2. Total expenses fell 35.1% while revenue grew 25.9%. 3. PayPal is the primary payment channel at 53.9% of revenue. 4. The largest customer contributed $16,346 (21% of total revenue).
Financial Analysis
| Ratio | Value | Benchmark | |
|---|---|---|---|
| Gross Profit Margin | 97.4% | 15-25% | Excellent |
| Net Profit Margin | 30.6% | 5-10% | Excellent |
| Expense-to-Revenue | 61.5% | 70-85% | Good |
| Current Ratio | 14.0x | 1.5-2.0x | Excellent |
| Debt-to-Equity | 0.0x | 0.5-1.5x | Excellent |
| Cash Runway | 14+ mo | 3-6 mo | Excellent |
| Quality of Earnings | 1.05x | >1.0x | Good |
| Revenue per $ Expense | $1.63 | $1.20-1.50 | Good |
| Category | 2023 | % of Revenue |
|---|---|---|
| Contractors | 9,879 | 12.7 |
| Meals & Entertainment | 8,375 | 10.8 |
| PayPal Expense | 7,053 | 9.1 |
| Car & Truck | 3,985 | 5.1 |
| Insurance | 3,648 | 4.7 |
| Travel | 3,235 | 4.2 |
| Job Supplies | 2,932 | 3.8 |
| Phone & Internet | 2,665 | 3.4 |
| Office Supplies & Software | 2,396 | 3.1 |
| Other Operating Exp | 3,510 | 4.5 |
Monthly P&L Trend
| Metric | Jan | Feb | Mar | Apr | May | Jun | Jul | Aug | Sep | Oct | Nov | Dec |
|---|---|---|---|---|---|---|---|---|---|---|---|---|
| Revenue | 10,321 | 6,964 | 6,911 | 6,375 | 6,818 | 8,076 | 506 | 6,976 | 11,306 | 6,906 | 5,893 | 496 |
| COGS | 189 | 404 | 62 | 197 | 34 | 58 | 8 | 357 | 257 | 486 | 126 | 18 |
| Gross Profit | 10,133 | 6,560 | 6,849 | 6,179 | 6,784 | 8,018 | 498 | 6,619 | 11,049 | 6,420 | 5,767 | 478 |
| Total Expenses | 6,100 | 4,737 | 4,009 | 4,030 | 4,324 | 5,876 | 837 | 2,671 | 4,679 | 6,531 | 3,327 | 558 |
| Net Income | 3,447 | 1,629 | 2,576 | 1,923 | 2,342 | 2,028 | (334) | 3,757 | 6,027 | (1,436) | 1,819 | (68) |
Trend: Revenue peaked in September ($11.3K) and January ($10.3K). July and December are anomaly months with near-zero revenue ($506 and $496). Q3 was the most profitable quarter at 50.3% net margin due to controlled expenses. October was a near-break-even month ($6.9K revenue, $6.5K expenses).
Quarterly Performance
| Quarter | Revenue | Expenses | Net Income | Margin |
|---|---|---|---|---|
| Q1 (Jan-Mar) | 24,196 | 14,847 | 7,651 | 31.6% |
| Q2 (Apr-Jun) | 21,270 | 14,230 | 6,294 | 29.6% |
| Q3 (Jul-Sep) | 18,788 | 8,186 | 9,450 | 50.3% |
| Q4 (Oct-Dec) | 13,294 | 10,416 | 315 | 2.4% |
| Annual | 77,549 | 47,679 | 23,711 | 30.6% |
| Revenue Channel | Amount | % |
|---|---|---|
| PayPal Sales | 41,815 | 53.9 |
| Direct Sales | 30,871 | 39.8 |
| Channel Sales | 4,863 | 6.3 |
| Total Revenue | 77,549 | 100.0 |
Executive Summary
Engagement Summary
Full-cycle financial analysis for a California-based last-mile delivery startup transitioning from QuickBooks Online. Built monthly P&L with YoY comparatives, revenue channel analysis across PayPal/direct/channel sales, expense benchmarking, cash flow analysis, and DCF valuation. Identified $31.5K in expense reductions and a 223.5% net income swing.
Outlook
The business is well-positioned for growth with strong fundamentals, zero debt, and improving cash reserves. Primary focus areas: diversifying revenue beyond PayPal dependency, managing expense discipline, and building formal operating procedures.
Strengths
- Exceptional 97.4% gross margin — asset-light service model
- Zero long-term debt — conservative capital structure
- 14+ months cash runway — strong liquidity position
- 30.6% net margin exceeds industry benchmarks significantly
Areas for Improvement
- Revenue concentration: 53.9% through PayPal, 21% from single customer
- Extreme monthly volatility: $496 to $11,306 range (22x)
- $21.7K Venmo informal liability — no repayment terms documented
- Meals & Entertainment at 10.8% of revenue flags audit risk
Key Achievements
1 Delivered a 223.5% profit swing — from a $19.2K loss to $23.7K net income in a single year
2 Reduced operating expenses by 35.1% ($25.8K) while revenue grew 25.9%
3 Grew cash reserves from $457 to $16,541 — a 36x improvement in liquidity
4 Achieved zero long-term debt with only $1,178 in minimal current liabilities
5 Identified $31.5K in YoY expense savings with 9 out of 19 expense categories reduced