Annual Financial Review
Restaurant Group
UAE Restaurant Group · Year Ended 31 December 2025 · AED
AED 2.21M
Total Revenue
AED 1.36M
Gross Profit
AED 221.5K
EBITDA
AED 694K
Staff Costs
AED 61.4K
Net Loss
Profit & Loss Statement
| Particulars | AED | % |
|---|---|---|
| Revenue | ||
| Restaurant (Dine-in & Take-away) | 1,869,543 | 84.8 |
| Talabat | 240,222 | 10.9 |
| Noon | 129,884 | 5.9 |
| Deliveroo | 87,534 | 4.0 |
| Zomato | 26,631 | 1.2 |
| Keeta | 34,178 | 1.5 |
| Catering | 8,933 | 0.4 |
| Commission Expense | (191,269) | (8.7) |
| Total Revenue | 2,205,655 | 100.0 |
| Cost of Revenue | ||
| Food Cost | 717,142 | 32.5 |
| Drinks Cost | 32,958 | 1.5 |
| Packaging | 21,644 | 1.0 |
| Direct Overheads | 74,960 | 3.4 |
| Total Cost of Revenue | 846,704 | 38.4 |
| Operating Expenses | ||
| Staff Costs | 694,323 | 31.5 |
| G&A Expenses | 441,776 | 20.0 |
| Marketing | 1,304 | 0.1 |
| Total OpEx (excl. depn) | 1,137,403 | 51.6 |
| EBITDA | 221,548 | 10.0 |
| Depreciation | 198,092 | 9.0 |
| Loss on Disposal | 84,851 | 3.8 |
| Net Loss | (61,395) | (2.8) |
Staff Costs Breakdown
| Category | AED | % |
|---|---|---|
| Staff Salaries | 470,465 | 21.3 |
| Other Staff Costs | 105,480 | 4.8 |
| Staff Accommodation | 118,379 | 5.4 |
| Total Staff Costs | 694,323 | 31.5 |
G&A Expenses Breakdown
| Category | AED |
|---|---|
| Restaurant Rent | 116,501 |
| Repair & Maintenance | 107,727 |
| Miscellaneous Expenses | 70,707 |
| Utilities (DEWA, District Cooling) | 42,851 |
| Government Fees (Trade License) | 33,779 |
| Fuel Expenses | 20,669 |
| Legal & Professional Fees | 18,415 |
| Communication (Du, Etisalat) | 16,016 |
| Travelling | 9,112 |
| Pre-Opening Expenses | 2,962 |
| IT Expenses | 1,872 |
| Bank Charges | 1,166 |
| Total G&A Expenses | 441,776 |
Notes: 1. Restaurant commenced operations February 2025 (January = pre-opening). 2. EBITDA = Earnings Before Interest, Tax, Depreciation & Amortisation. 3. Loss on disposal: government demolished outside dining area.
Financial Analysis
| Ratio | Value | Benchmark | |
|---|---|---|---|
| Gross Profit Margin | 61.6% | 60-70% | Good |
| EBITDA Margin | 10.0% | 10-15% | Good |
| Net Profit Margin | -2.8% | 5-10% | Check |
| Food Cost % | 32.5% | 28-35% | Good |
| Staff Cost % | 31.5% | 25-35% | Good |
| G&A Cost % | 20.0% | 10-15% | High |
| Current Ratio | 3.9x | >1.5x | Good |
| Quick Ratio | 1.8x | >1.0x | Good |
| Inventory Turnover | 27.8x | >12x | Good |
| Days Inventory Outstanding | 13.1d | <30d | Good |
| Channel | AED | % |
|---|---|---|
| Dine-in & Take-away | 1,869,543 | 84.8 |
| Talabat | 240,222 | 10.9 |
| Noon | 129,884 | 5.9 |
| Deliveroo | 87,534 | 4.0 |
| Zomato | 26,631 | 1.2 |
| Keeta | 34,178 | 1.5 |
| Catering | 8,933 | 0.4 |
| Commission Expense | (191,269) | (8.7) |
Monthly P&L Trend
| Metric | Feb | Mar | Apr | May | Jun | Jul | Aug | Sep | Oct | Nov | Dec |
|---|---|---|---|---|---|---|---|---|---|---|---|
| Revenue | 56,859 | 302,200 | 199,780 | 204,190 | 186,487 | 201,997 | 228,749 | 177,204 | 203,649 | 223,486 | 221,054 |
| COGS | 32,153 | 141,943 | 75,011 | 78,990 | 72,918 | 79,081 | 72,069 | 75,718 | 82,912 | 49,909 | 86,002 |
| Gross Profit | 24,706 | 160,257 | 124,769 | 125,200 | 113,569 | 122,916 | 156,680 | 101,486 | 120,737 | 173,577 | 135,052 |
| Staff Costs | 29,782 | 40,289 | 68,980 | 56,511 | 76,764 | 62,163 | 71,643 | 70,118 | 71,210 | 72,248 | 74,616 |
| G&A Expenses | 35,243 | 30,213 | 59,988 | 53,212 | 47,590 | 46,134 | 29,170 | 35,797 | 32,642 | 25,354 | 46,434 |
| Marketing | 0 | 0 | 0 | 1,256 | 0 | 0 | 0 | 48 | 0 | 0 | 0 |
| EBITDA | (40,319) | 89,755 | (4,199) | 14,221 | (10,785) | 14,619 | 55,867 | (4,477) | 16,885 | 75,975 | 14,002 |
| Depreciation | 14,608 | 15,443 | 15,808 | 16,113 | 18,015 | 18,505 | 20,279 | 20,429 | 20,547 | 20,614 | 17,732 |
| Loss on Disposal | 0 | 0 | 0 | 0 | 0 | 0 | 0 | 0 | 0 | 0 | 84,851 |
| Net Profit/(Loss) | (54,927) | 74,312 | (20,007) | (1,892) | (28,800) | (3,886) | 35,588 | (24,906) | (3,662) | 55,361 | (88,581) |
Trend: Revenue peaked in March (AED 302K) and November (AED 223K). EBITDA positive from March onwards with intermittent losses. December includes AED 84.9K one-time disposal loss. Staff costs scaled through the year.
Balance Sheet Highlights
| Assets | May 2026 | Jun 2026 | Change |
|---|---|---|---|
| Cash & Equivalents | 65,894 | 45,668 | (20,226) |
| Accounts Receivable | 32,562 | 23,953 | (8,609) |
| Inventory | 42,744 | 35,080 | (7,664) |
| Other Current Assets | 52,999 | 56,421 | 3,422 |
| Total Current Assets | 194,199 | 161,122 | (33,077) |
| Fixed Assets (Net) | 586,242 | 568,197 | (18,045) |
| Other Non-Current Assets | 13,000 | 19,105 | 6,105 |
| Total Assets | 793,441 | 748,424 | (45,017) |
| Liabilities & Equity | May 2026 | Jun 2026 | Change |
|---|---|---|---|
| Accounts Payable | 44,467 | 13,863 | (30,604) |
| Other Current Liabilities | 62,781 | 70,355 | 7,574 |
| Total Liabilities | 902,208 | 879,178 | (23,030) |
| Shareholders’ Loans | 794,960 | 794,960 | 0 |
| Retained Earnings / (Deficit) | (903,727) | (925,714) | (21,987) |
| Total Equity | (108,767) | (130,754) | (21,987) |
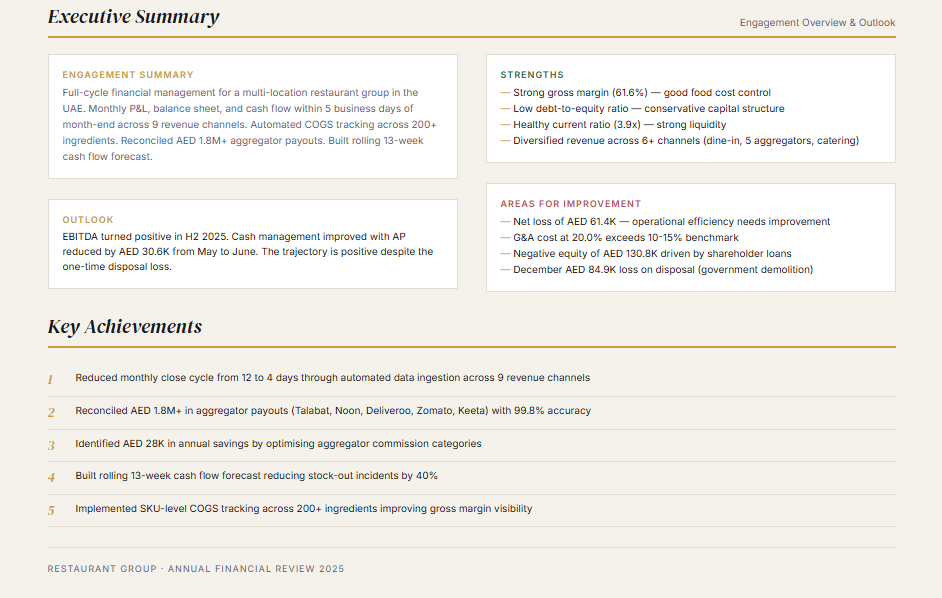
Executive Summary
Engagement Summary
Full-cycle financial management for a multi-location restaurant group in the UAE. Monthly P&L, balance sheet, and cash flow within 5 business days of month-end across 9 revenue channels. Automated COGS tracking across 200+ ingredients. Reconciled AED 1.8M+ aggregator payouts. Built rolling 13-week cash flow forecast.
Outlook
EBITDA turned positive in H2 2025. Cash management improved with AP reduced by AED 30.6K from May to June. The trajectory is positive despite the one-time disposal loss.
Strengths
- Strong gross margin (61.6%) — good food cost control
- Low debt-to-equity ratio — conservative capital structure
- Healthy current ratio (3.9x) — strong liquidity
- Diversified revenue across 6+ channels (dine-in, 5 aggregators, catering)
Areas for Improvement
- Net loss of AED 61.4K — operational efficiency needs improvement
- G&A cost at 20.0% exceeds 10-15% benchmark
- Negative equity of AED 130.8K driven by shareholder loans
- December AED 84.9K loss on disposal (government demolition)
Key Achievements
1 Reduced monthly close cycle from 12 to 4 days through automated data ingestion across 9 revenue channels
2 Reconciled AED 1.8M+ in aggregator payouts (Talabat, Noon, Deliveroo, Zomato, Keeta) with 99.8% accuracy
3 Identified AED 28K in annual savings by optimising aggregator commission categories
4 Built rolling 13-week cash flow forecast reducing stock-out incidents by 40%
5 Implemented SKU-level COGS tracking across 200+ ingredients improving gross margin visibility