Retained Earnings — $1,067,437 Variance
QBD may be missing historical data or transactions. QBO may have incorrect prior year closing entries or improper opening balances during migration.
Bank Accounts — $1,524,401 Missing from QBD
QBO shows a primary Chequing account with $1.52M that doesn't appear in QBD. Massive cash reconciliation issue — entire bank account structure differs between systems.
Tax Liabilities — $141,376 Variance
QBO shows significantly higher GST/HST ($81,252 vs $8,706) and PST ($68,955 vs $126). Could mean additional sales recorded in QBO, unreconciled tax payments in QBD, or potential tax filing compliance issues.
Revenue Recognition — $355,980 in Unmatched Revenue
QBO has two extra revenue categories not present in QBD. $283,599 in Services and $72,381 in Sales need verification against actual business activity.
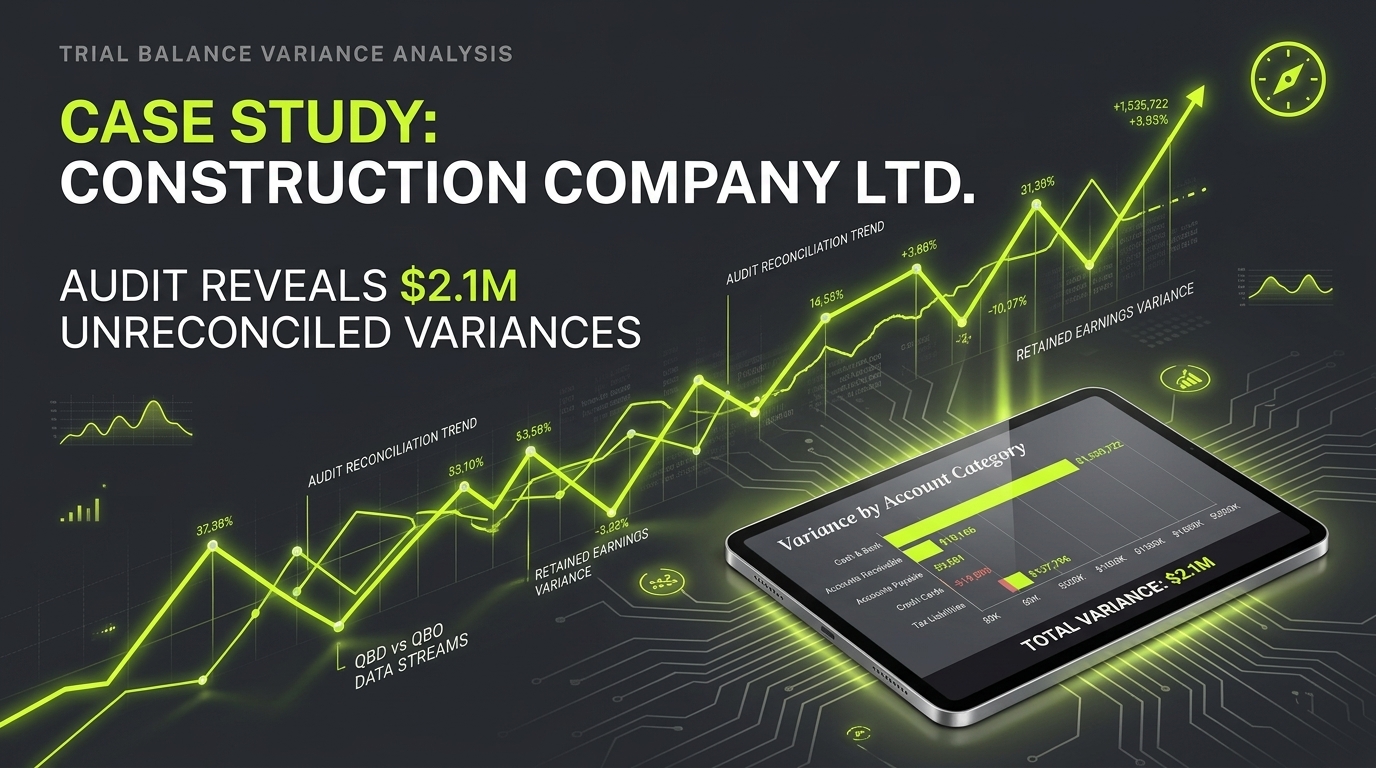
Variance by Account Category
Balance sheet accounts
Critical Issue Breakdown
4 issues driving 97% of variance
| Category | QBD Total | QBO Total | Variance |
|---|---|---|---|
| Cash & Bank | $19,084 | $1,554,806 | $1,535,722 |
| Accounts Receivable | $8,983 | $19,148 | $10,166 |
| Accounts Payable | $10,620 | $14,202 | $3,581 |
| Credit Cards | $60,052 | $40,162 | -$19,890 |
| Tax Liabilities | $12,411 | $150,207 | $137,796 |
| Total Revenue | $558,096 | $913,774 | $355,679 |
| QBD Account Name | QBO Account Name | Amount |
|---|---|---|
| Accounts Receivable (*) | Accounts Receivable (A/R) | $8,983 / $19,148 |
| Bank Service Charges | Bank charges | $2,461 |
| Casual Labor | Casual labor | $750 |
| Professional Fees | Legal and professional fees | $6,156 |
| Scotialine VISA 3015 | Scotialine VISA 3015 | $28,667 |
| Government Grant | Government Grant | $466 |
| Misc income | Other Ordinary Income | $314 |
| Interest Income | Interest earned | $3,692 |
| Interest expense | Interest expense | $1,641 |
| Patronage dividends | Patronage Dividends | $574 |
| Freight | Freight | $431 |
| Landfill | Landfill | $667 |
Accounts Only in QBD
18 accounts, $587,871 total
Accounts Only in QBO
11 accounts, $1,919,379 total
| Type | Account | Amount | Notes |
|---|---|---|---|
| QBD Only | Subcontractors Expense | $189,712 | Major expense missing from QBO |
| QBD Only | Construction Materials Costs | $130,898 | COGS not captured in QBO |
| QBD Only | Payroll Expenses | $89,448 | Matches QBO Payroll Direct Labor |
| QBD Only | Travel | $53,726 | Large expense unaccounted in QBO |
| QBO Only | Chequing | $1,524,401 | Primary bank account - CRITICAL |
| QBO Only | Services | $283,599 | Revenue category not in QBD |
| QBO Only | Sales | $72,381 | Revenue category not in QBD |
| QBO Only | Home Hardware PRO 6506 | $39,702 | Credit card not in QBD |
| Account | Balance |
|---|---|
| Cash on hand | $39,217 |
| Business Visa LOC | $13,631 |
| Infinite Visa | $8,521 |
| Scotiabank Business Chequing | $4,460 |
| Scotiabank Business Savings | $4,460 |
| Black BMO | $1,571 |
| Pioneer Coop Account | $500 |
| Medical Expense | $72 |
Retained Earnings Reconciliation
Investigate the $1.07M variance by reviewing prior year financials and closing entries. Verify opening balance equity treatment during QBO migration.
Bank Account Alignment
Determine why QBD is missing the $1.52M Chequing account. Verify all bank accounts are properly set up and reconciled across both systems.
Tax Liability Review
Reconcile the $141K tax variance with the accounting team. Ensure tax filings are based on correct balances and no compliance exposure exists.
Revenue Categorization
Confirm validity of "Sales" and "Services" categories in QBO. Resolve the $10K A/R variance. Clean up deleted accounts with active balances.
Process Improvement
Create a standardized Chart of Accounts mapping document between QBD and QBO. Implement monthly variance checks to catch discrepancies early.