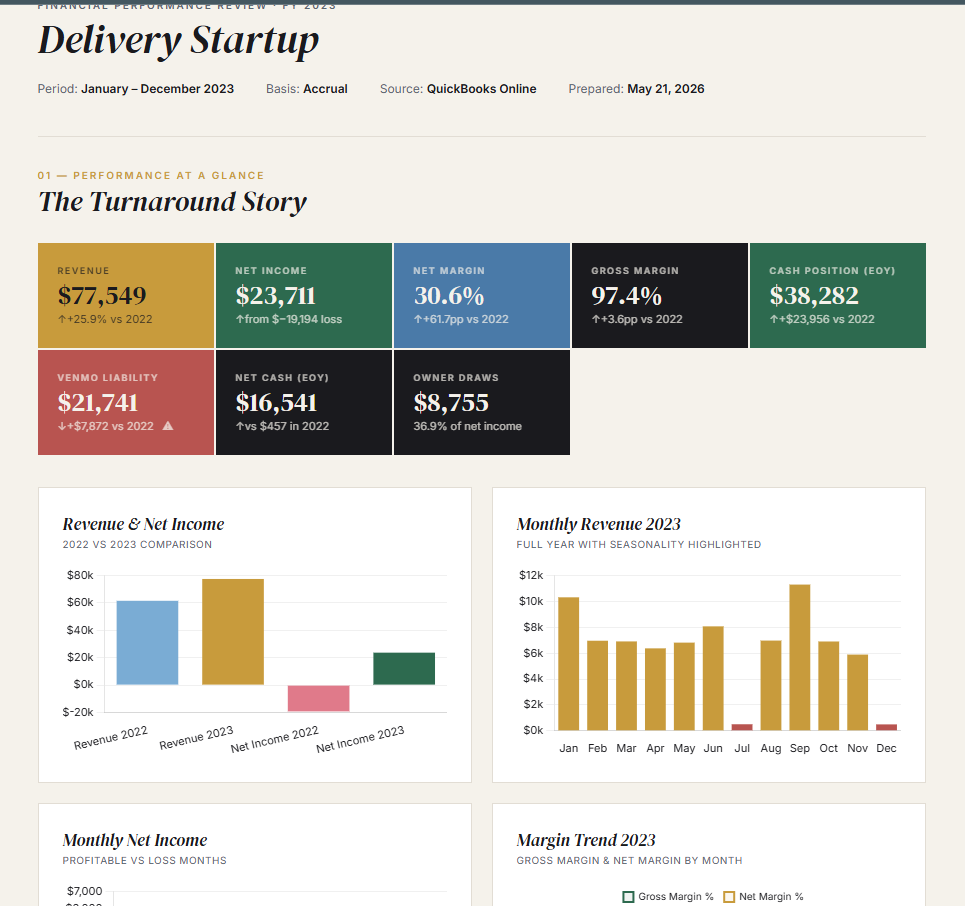
Revenue & Net Income
2022 vs 2023 Comparison
Monthly Revenue 2023
Full year with seasonality highlighted
Monthly Net Income
Profitable vs loss months
Margin Trend 2023
Gross margin & net margin by month
Expense Category Breakdown 2023
Operating expenses by category
YoY Expense Variances
2023 vs 2022 — material changes
Monthly Expenses vs Revenue 2023
Operating leverage visualised
Monthly Cash Position (excl. Venmo)
2022 vs 2023 trajectory
Cumulative Cash Retained 2023
Net income less owner draws
Account Balance Migration
How funds shifted across accounts during 2023
Cash Flow Waterfall
How net income was allocated in 2023
Quarterly Revenue, Expenses & Net Income
Q1–Q4 2023 performance breakdown
Quarterly Net Margin
Profitability by quarter
5-Year Free Cash Flow Projections
10% revenue growth, 35% EBITDA margin, 11% WACC
Valuation Composition
PV of FCFs vs terminal value
| Year | Revenue | EBITDA | Free Cash Flow | PV of FCF |
|---|---|---|---|---|
| Base (2023) | $77,549 | $27,142 | $23,711 | — |
| Year 1 | $85,304 | $29,856 | $23,800 | $21,448 |
| Year 2 | $93,834 | $32,842 | $26,180 | $21,261 |
| Year 3 | $103,217 | $36,126 | $28,798 | $21,077 |
| Year 4 | $113,539 | $39,739 | $31,677 | $20,893 |
| Year 5 | $124,893 | $43,713 | $34,845 | $20,712 |
| Enterprise Value | PV FCFs $105,391 + PV Terminal $250,789 | $356,180 | ||
| Equity Value | Enterprise Value + Net Cash $16,541 | $372,721 | ||
Venmo Liability
$21,741 informal liability grew 56.8% YoY. Represents 56.8% of positive cash. No formal repayment terms — creates legal and financial uncertainty.
Revenue Seasonality
July ($506) and December ($496) near-zero revenue months. Q4 generates only $315 net income. Cash reserves must cover 2 near-dead months annually.
Single Year Profitability
2023 is the first profitable year on record. The sustainability of the 35% expense reduction needs 2+ more years of data to confirm as structural, not one-off.
Owner Dependency
Business valuation closely tied to owner-operator. No documented systems or recurring contracts. If the owner steps away, revenue continuity is uncertain.
Owner Draw Policy
Draws of $8,755 were within net income (36.9% payout ratio). However, no formal policy exists — ad-hoc draws could erode equity in a down year.
Insurance Coverage
Current spend of $3,648/year may be insufficient for a delivery operation with vehicle exposure. Needs review against actual risk exposure.
Formalize the Venmo Arrangement Immediate
Document repayment terms, interest (if any), and timeline. The $21,741 informal liability is the single largest financial risk to the business. Treat it like a real loan.
Separate Personal & Business Finances Immediate
Stop commingling personal expenses through business accounts. This distorts reporting and creates tax exposure. Open a dedicated personal account if not already done.
Build a 3-Month Cash Reserve Immediate
Target minimum $11,920 in liquid reserves (3× average monthly expenses of $3,973). July and December can generate near-zero revenue — be prepared.
Create a Seasonal Revenue Strategy 90 Days
Develop an active plan to cover July and December lean months. Consider promotions, new service offerings, or part-time alternative revenue during dead months.
Set a Formal Owner Draw Policy 90 Days
Cap draws at 50–70% of trailing 3-month net income. Never draw more than you've earned in that period. This protects the business in down months like Oct and Dec.
Diversify Revenue Channels 6 Months
Reduce dependency on any single platform. Channel Sales ($46,678) and PayPal ($41,815) are healthy — explore a third channel or direct recurring contracts to smooth revenue.
Build a Forward-Looking Budget 6 Months
Move from prior-year comparison to an actual monthly budget. This enables real-time variance tracking and faster decision-making when expenses deviate.
Review Insurance Coverage 6 Months
At $3,648/year, coverage may be thin for a delivery operation with vehicle liability exposure. Get a professional review — one claim could wipe out a year of profit.